Market Intelligence: Understanding Your Product's Metrics
Market Intelligence: Understanding Your Product's Metrics
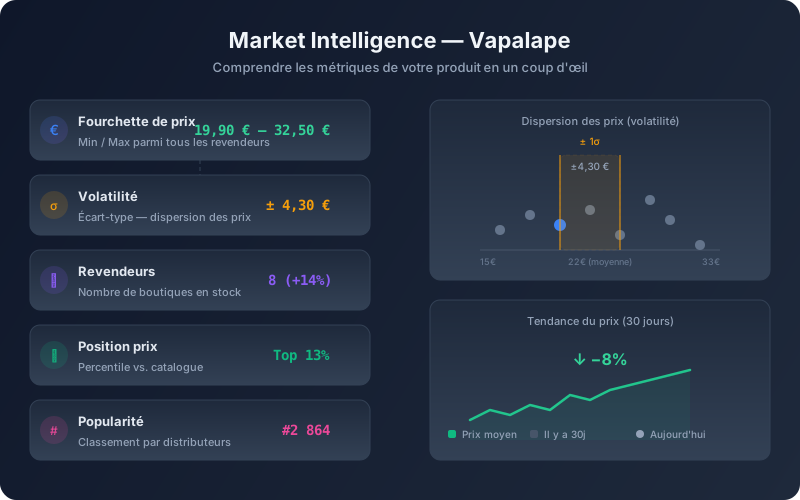
On every product page, Vapalape displays a Market Insight block that gives you a clear, instant snapshot of a product's position in the market. But what exactly do these indicators mean? This guide explains each metric in detail.
Price Range
Min / Max across all active retailers
The price range shows the lowest (price_min) and highest (price_max) prices found among all retailers that carry this product in stock.
How to interpret:
- A narrow range (e.g. 19.90 € – 22.50 €) signals an aligned market: prices are consistent, competition is healthy.
- A wide range (e.g. 15.00 € – 45.00 €) reveals arbitrage opportunities: some retailers are undercutting, others are significantly higher.
- A flat range (min = max) means the product is only available from a single retailer.
Volatility
Standard deviation of prices across retailers — shown as ±X.XX €
Volatility measures the price dispersion around the mean. Mathematically, it's the standard deviation (STDDEV) calculated across all active retailers' prices.
How to interpret:
| Volatility | Meaning |
|---|---|
| Low (±1–2 €) | Stable market, consistent prices across stores |
| High (±10–15 €) | Strong dispersion: some retailers are heavily discounting |
| Absent | Only one retailer — standard deviation cannot be computed |
Concrete example: a product sold at 19.90 €, 22.90 €, 24.50 €, and 30.00 € will have a volatility of about ±4.50 €. This means most prices fall between ~17.50 € and ~26.50 €.
Retailers
Number of stores currently offering this product in stock
This counter (retailers_tracked) shows how many active retailers list this product with available stock.
Evolution (percentage shown next to it): the change compared to 30 days ago (retailers_evolution_pct).
- +14% → more and more retailers are carrying it. The product is gaining availability.
- −25% → retailers have dropped it. The product is becoming scarce (widespread stockouts, discontinued…).
- Absent → not enough history (< 30 days of data).
Price Position
Percentile of the average price relative to the entire catalog — displayed as "Top X%"
The price position (price_percentile) compares this product's average price to all other products in Vapalape's catalog.
"Top 13%" means: this product is cheaper than 87% of all products. It ranks among the cheapest 13%.
This is a very useful indicator to know whether a product is a good deal or expensive in absolute terms, regardless of its category.
Popularity
Ranked by number of retailers — displayed as "#XXXX"
Popularity (popularity_rank) is a ranking: the more retailers carry a product, the higher it ranks.
- #1 = the most widely distributed product in the catalog
- #10,000 = a very niche product
This is an excellent popularity proxy: a best-seller will naturally be listed by more stores than a niche product.
First Seen
Date when Vapalape first detected this product
The first_detected date marks the moment when the very first retailer listed this product and our spider collected it.
The older this date, the more price history we have, making other metrics (trend, retailer evolution) more reliable.
Price Trend
Direction of the average price: ↑ rising, ↓ falling, → stable
The trend (price_trend) compares the current average price to the average price 30 days ago:
- ↑ Rising: average price increased by more than 2% over 30 days
- ↓ Falling: average price decreased by more than 2% over 30 days
- → Stable: variation under 2%
This indicator tells you whether now is the right time to buy: a downward trend suggests waiting a bit longer, an upward trend suggests buying now.
Why Are These Metrics Reliable?
All Market Intelligence metrics are calculated from the market_intelligence materialized view, refreshed automatically every 10 minutes. The raw data comes from:
- Collection spiders that scrape real prices from partner stores
- The ingestion pipeline that normalizes and deduplicates data
- Product matching that merges identical products sold under different names
Statistical calculations (standard deviation, percentile, rank) are performed directly by PostgreSQL to ensure accuracy and performance.
Last updated: July 27, 2026